


Intro
Over the last decade, the way engineers interacted with the observability data of the platform they were building converged to a similar point: a handful of datasources wired into a central visualization tool, usually Grafana. When it came time to find an answer, sometimes a dashboard already existed that solved your exact question. Other times you'd be writing a one-off query and praying you hadn't overlooked something.
Querying the ethPandaOps stack has looked very similar since our team was conceived in 2022. Prometheus metrics lived in Victoriametrics, logs in Loki, Xatu data lived in ClickHouse, all accessible via Grafana. Each had a different query language and correlating data between sources was painful and tedious. This process also involved a human in the loop by relying on an authenticated web browser to click through the Grafana UI resulting in friction for agents.
We built Panda to solve these problems in an opinionated and streamlined way with the goal of unlocking new ways of working. Panda collapses everything into a single interface. It's a CLI, an MCP server, and a sandboxed Python runtime that already knows how to reach every datasource we run, and through our hosted credential proxy it's open to any Ethereum core dev. This post walks through how it works, and how it became part of our daily workflow.
What didn't work
The obvious way to wire a data stack into an LLM is one MCP tool per datasource. We built exactly that a year ago: an ethpandaops-data MCP server with a loki_tool, a prometheus_tool, and a clickhouse_tool, each pointed at our Grafana datasources.
It sort of worked, but it had a massive problem. Every tool would hand its raw result straight back to the model, serialized as pretty-printed JSON. Ask the clickhouse_tool for blob counts per block over the last day and ~7000 rows of JSON would land straight in the context window. Not only was this extremely expensive, but it was also limiting the complexity and reliability of our agents, as context rot would corrupt the original question and the agent would get confused (sometimes completely forgetting its original task after firing off a single query!)
This was also limited in its usefulness. An agent with ~7000 rows in its context couldn't easily calculate an aggregate over all the rows. We experimented with ideas like piping through jq, but found it was too rigid for all our use-cases.
Panda: Empowering Agents
Panda gives the model a runtime environment instead of a pile of tools. The MCP surface is just three tools, each mirrored by a CLI command:
execute_python(panda execute) runs code in a sandboxmanage_session(panda session) keeps a sandbox warm between callssearch(panda search) does semantic search over query examples, runbooks, EIPs, and consensus specs
Everything past that is a Python library inside the sandbox, and it spans the whole stack: ClickHouse, Prometheus, Loki, Dora, and the beacon and execution nodes. The blob query that flooded the window above comes back as a summary instead:
panda execute --code '
from ethpandaops import clickhouse

df = clickhouse.query("xatu-cbt", """
    SELECT blob_count
    FROM mainnet.fct_block_blob_count_head FINAL
    WHERE slot_start_date_time >= now() - INTERVAL 1 DAY
""")
print(df["blob_count"].describe())
'
The ~7000 rows live and die inside the sandbox, and only the eight-line summary that describe() prints ever travels back to the model. When the model needs a loop or a join, that runs in the sandbox too, instead of turning into hundreds of tool calls with every intermediate row passing back through the window.
Anthropic wrote this pattern up well in Code execution with MCP, and we strongly recommend it. Today's models are very good at writing code so this was an overnight productivity multiplier for us.
Architecture
Our observability platform has a unique access pattern: we aren't the only ones who use it! Many Ethereum core devs use our data daily to check in on how the 854th iteration of their devnet is performing, or if Mainnet is still kicking. Handing out individual credentials to all of them isn't maintainable, and not all of the tools we use allow for fine-grained permissions.
We were also now giving agents direct access to our backend infrastructure like VictoriaMetrics, Clickhouse and Loki. This meant that an agent could trivally pull these credentials from its runtime environment, leaking them to the inference provider.
To solve these issues we split Panda in to multiple components:
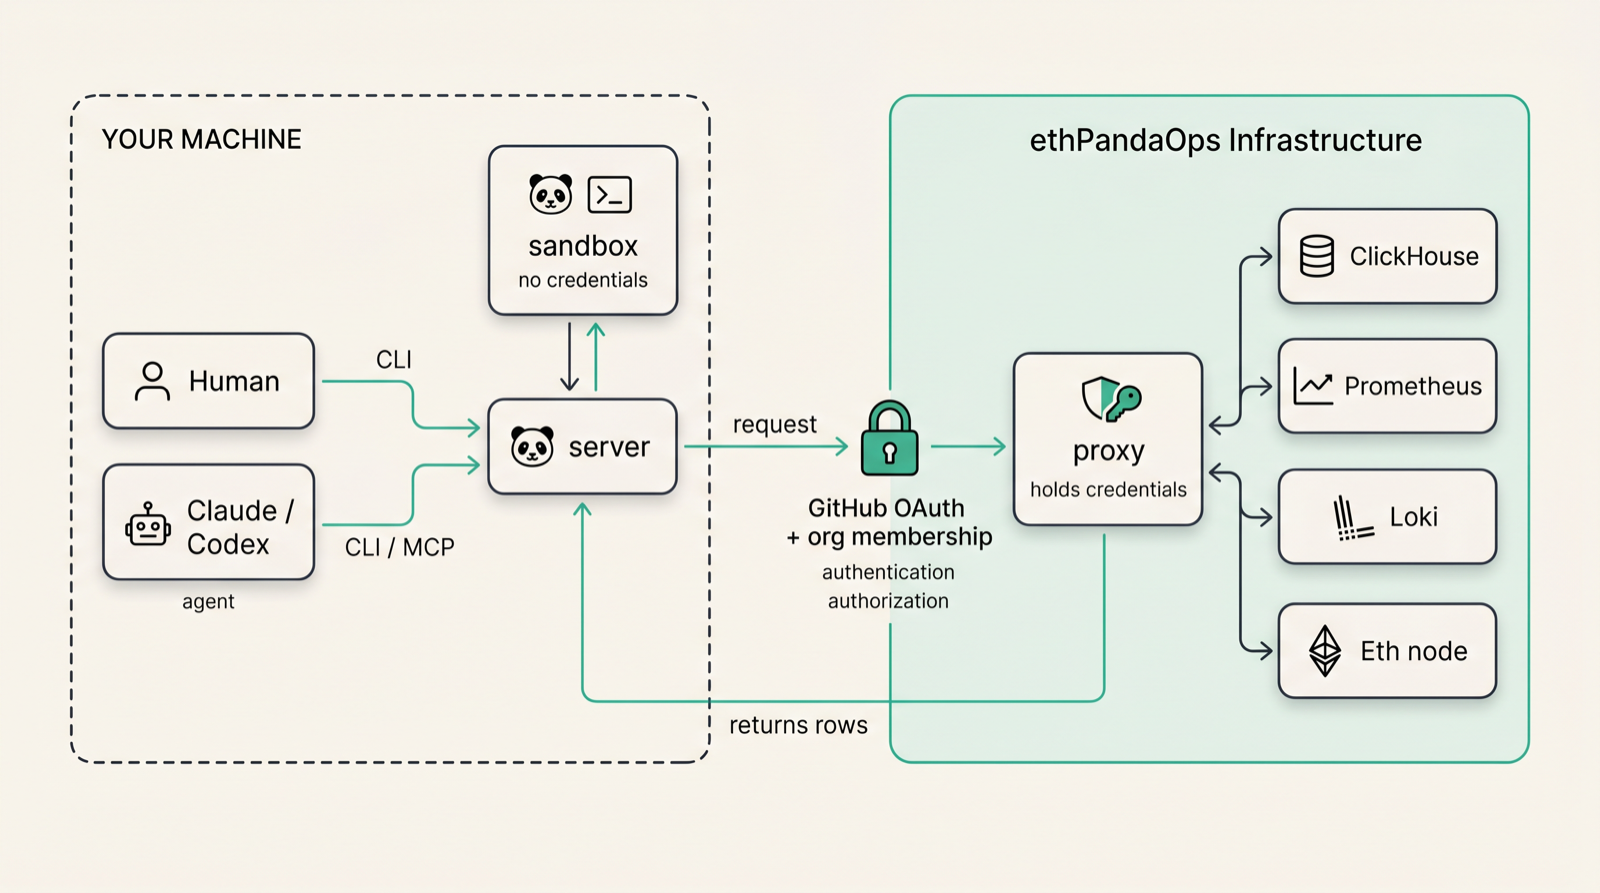
Server
Server is the main interaction point for both humans and agents. It exposes an MCP & CLI interface that provides access to the rest of the components. It's responsible for negotiating auth against the proxy. It runs on your machine and is the glue that brings everything else together.
Credential Proxy
The proxy is the only thing that ever holds a password for our datasources. Our team hosts an instance of proxy, which is what actually talks to our backend services like Clickhouse, Victoriametrics and Loki. It validates authentication tokens, and only shows the user the datasources the user actually has access to. It also gives us a consistent observability surface for all these datasources so we can see what's actually being used.
For Panda users, the onboarding flow looks something like this: you sign in to the hosted proxy with GitHub, your queries run locally on your own machine, and you don't have to worry about any credentials. New datasources will appear in Panda automatically as our team adds them.
Sandbox
The sandbox does the grunt work. It's a Python container that runs on your own machine as we've found that compute best kept close to whoever is asking the question. It uses a custom docker image that is shipped alongside Panda, which includes Python wrappers for interacting with our datasources.
The code running in the sandbox was probably written by an LLM and it's about to be executed, so the sandbox treats it as hostile. Every container runs:
- as
nobody, with a read-only root filesystem - with every Linux capability dropped and
no-new-privilegesset - under pid, memory, and CPU limits
- on an isolated Docker network rather than the host network
The sandbox holds no credentials in the first place. It gets an API URL and a token scoped to the local server and nothing more, so even if the generated code went looking for a secret to exfiltrate, there is none in the container to take. The writable space is a small: /tmp, /workspace that survives between calls in the same session, and an /output mount for the files you want to pull back out.
Sessions
A sandbox isn't thrown away after a single call. When passing the session_id from the previous response into the next call, you get the same warm container back, with your imports still loaded and anything you wrote to /workspace still on disk. A sequence of execute_python calls becomes one analysis that can build on itself.
This pays off when one step is expensive and the next few want to reuse the result. The first call caches 30 days of block proposers to a parquet file:
panda execute --code '
from ethpandaops import clickhouse

proposers = clickhouse.query("xatu-cbt", """
    SELECT slot, proposer_validator_index AS validator
    FROM mainnet.fct_block_proposer FINAL
    WHERE slot_start_date_time >= now() - INTERVAL 30 DAY
""")
proposers.to_parquet("/workspace/proposers.parquet")
print(len(proposers), "proposals cached")
'
A later call in the same session reads that file straight back and joins it against a second query, without paying for the first one again:
panda execute --session 9bdd56e2 --code '
import pandas as pd
from ethpandaops import clickhouse

proposers = pd.read_parquet("/workspace/proposers.parquet")   # still here from the last call
correctness = clickhouse.query("xatu-cbt", """
    SELECT attesting_validator_index AS validator,
           avg(inclusion_distance)   AS avg_inclusion_distance
    FROM mainnet.fct_attestation_correctness_by_validator_canonical FINAL
    WHERE slot_start_date_time >= now() - INTERVAL 30 DAY
    GROUP BY validator
""")
joined = proposers.merge(correctness, on="validator", how="left")
print(joined["avg_inclusion_distance"].describe())
'
Discovery
Unfortunately we still had a discovery problem. Agents (and humans!) are non deterministic. We needed a way to guide Panda users to the correct workflows without front-loading their context.
To begin with, we created panda getting-started which acts as the first-hop for the user to learn how to get more information. All datasources are able to expose documentation around the data they provide. For instance, the Clickhouse datasource exposes schemas of the tables it's connected to via panda schema $table.
This covered what exists, but exact workflows are more complex. We landed on a document embedding index of 4 different types, allowing us to run semantic search across them.
- query examples (individual SQL, PromQL, and LogQL snippets)
- investigation runbooks (multi step procedures)
- EIPs
- consensus specs (protocol constants and spec text).
This is what lets an agent resolve a vague ask like "get distinct validators per slot from aggregate_and_proof" reliably, without knowing the exact table names up front. It also gives our team one place to capture the patterns and runbooks we've built up over the years, ready for either of us to reuse.
panda search runbooks "network not finalizing"
panda search eips "blob base fee"
panda search consensus-specs "MAX_EFFECTIVE_BALANCE"
panda search queries "block arrival"
The consensus specs go one step further and are a direct call away inside the sandbox, so a query can resolve a constant inline instead of hard-coding it:
panda execute --code '
from ethpandaops import specs
print(specs.get_constant("MAX_EFFECTIVE_BALANCE"))
print(specs.get_spec("deneb", "beacon-chain")["title"])
'
CLI or MCP?
We don't care either way.
The same server sits behind the MCP tools and the Panda CLI, so they share a library, a proxy, and the credential boundary. An agent can call the MCP tools directly or shell out to the CLI, the same as a human would.
The CLI gives you two ways to reach the data: panda clickhouse query proxies a single raw query straight to the datasource, while panda execute runs your code in the sandbox first. Frontier models are also smart enough to choose on the fly.
panda clickhouse query xatu-cbt "SELECT count() FROM mainnet.fct_block FINAL"
panda execute --code 'from ethpandaops import clickhouse; print(clickhouse.query("xatu-cbt", "SELECT count() FROM mainnet.fct_block FINAL"))'
How we use it
In practice, Panda is a tool we reach for every day when dealing with both the Ethereum protocol and our internal platform. Usually these are one-off questions that were previously too tedious to investigate: "How many attestations arrive after the aggregation deadline if the aggregator was in Australia compared to Europe?" We write some of the longer ones up at investigations.ethpandaops.io.
A recent query for our internal platform was "Why is kafka lag increasing?". The agent used Panda to check Victoriametrics to find why topics were lagging via Prometheus metrics, moved on to a Loki query for error logs from the consumer instances, and finally concluded that ClickHouse's write throughput was saturated via Clickhouse's metrics.
We are increasingly using agents to augment our use of Panda. It's usually much easier to ask Claude to interact with Panda than to run commands with bash ourselves.
Check it out
For those that are curious as to how Panda works under the hood: the full source, the self-hostable proxy, and the architecture docs all live at github.com/ethpandaops/panda. If you're an Ethereum Core Dev, you can use the ethPandaOps proxy already via panda init.
Love,
ethPandaOps Team