


Ethereum transactions trigger a sequence of EVM opcodes, each consuming gas according to the protocol's gas schedule. If you wanted to understand this execution at scale, across all transactions and blocks, you'd need an archive node and a lot of patience.
We've done that work for you. The Xatu dataset now includes full EVM execution trace data: per-opcode gas consumption, call frame hierarchies, and pre-aggregated analytics across 9 new tables. The data starts at block 24,120,000 and updates continuously through HEAD.
On top of this data, we built two tools in The Lab:
- A Gas Profiler for inspecting opcode-level gas consumption at the transaction, block, and network level
- A Gas Repricing Simulator that re-executes blocks with modified gas schedules, so you can test "what if" scenarios for gas repricing proposals
The Data Pipeline
The raw data comes from debug_traceTransaction structlogs: step-by-step EVM execution traces recording each opcode, its gas cost, stack depth, and error status. We run this against every finalized transaction and aggregate the results into canonical_execution_transaction_structlog_agg, which stores per-frame, per-opcode summaries.
From there, CBT  transforms this raw structlog data through several layers:
Each layer builds on the previous one. The intermediate tables (int_) feed into the fact tables (fct_), which power the time-series views in The Lab. All of them are queryable directly in the Xatu dataset.
New Tables
Full schema documentation: Source table | CBT tables
| Table | Description |
|---|---|
| int_transaction_call_frame | Call tree structure for each transaction. Each row is a call frame with self gas, cumulative gas, intrinsic gas, refunds, call type, target address, and function selector. |
| int_transaction_call_frame_opcode_gas | Per-frame opcode breakdown. Which opcodes a specific call frame executed and how much gas each consumed. |
| int_transaction_opcode_gas | Opcode aggregation at the transaction level. Total count and gas per opcode across all frames in a transaction. |
| int_block_opcode_gas | Block-level opcode aggregation. Each row is one opcode's usage within a single block: count, gas, and error count. |
| fct_opcode_gas_by_opcode_daily | Daily gas consumption ranked by opcode. Includes average gas per execution, block count, and error rates. |
| fct_opcode_gas_by_opcode_hourly | Hourly version of the above for finer-grained analysis. |
| fct_opcode_ops_daily | Daily EVM throughput: ops/sec with p5/p50/p95 percentiles, Bollinger bands, and 7-day moving averages. |
| fct_opcode_ops_hourly | Hourly version with 6-hour moving averages. |
Data Availability
EVM execution trace data is available from block 24,120,000 to HEAD. We're also backfilling earlier blocks. This will take a while given the volume of historical data, but we'll update coverage as it expands.
The intermediate and fact tables update incrementally, so new blocks show up shortly after finalization.
The Lab: Gas Profiler
The Gas Profiler lets you explore gas data at three levels: network, block, and transaction.
At the network level, you can track opcode operations per second over time with statistical bands and see gas consumption broken down by opcode category.
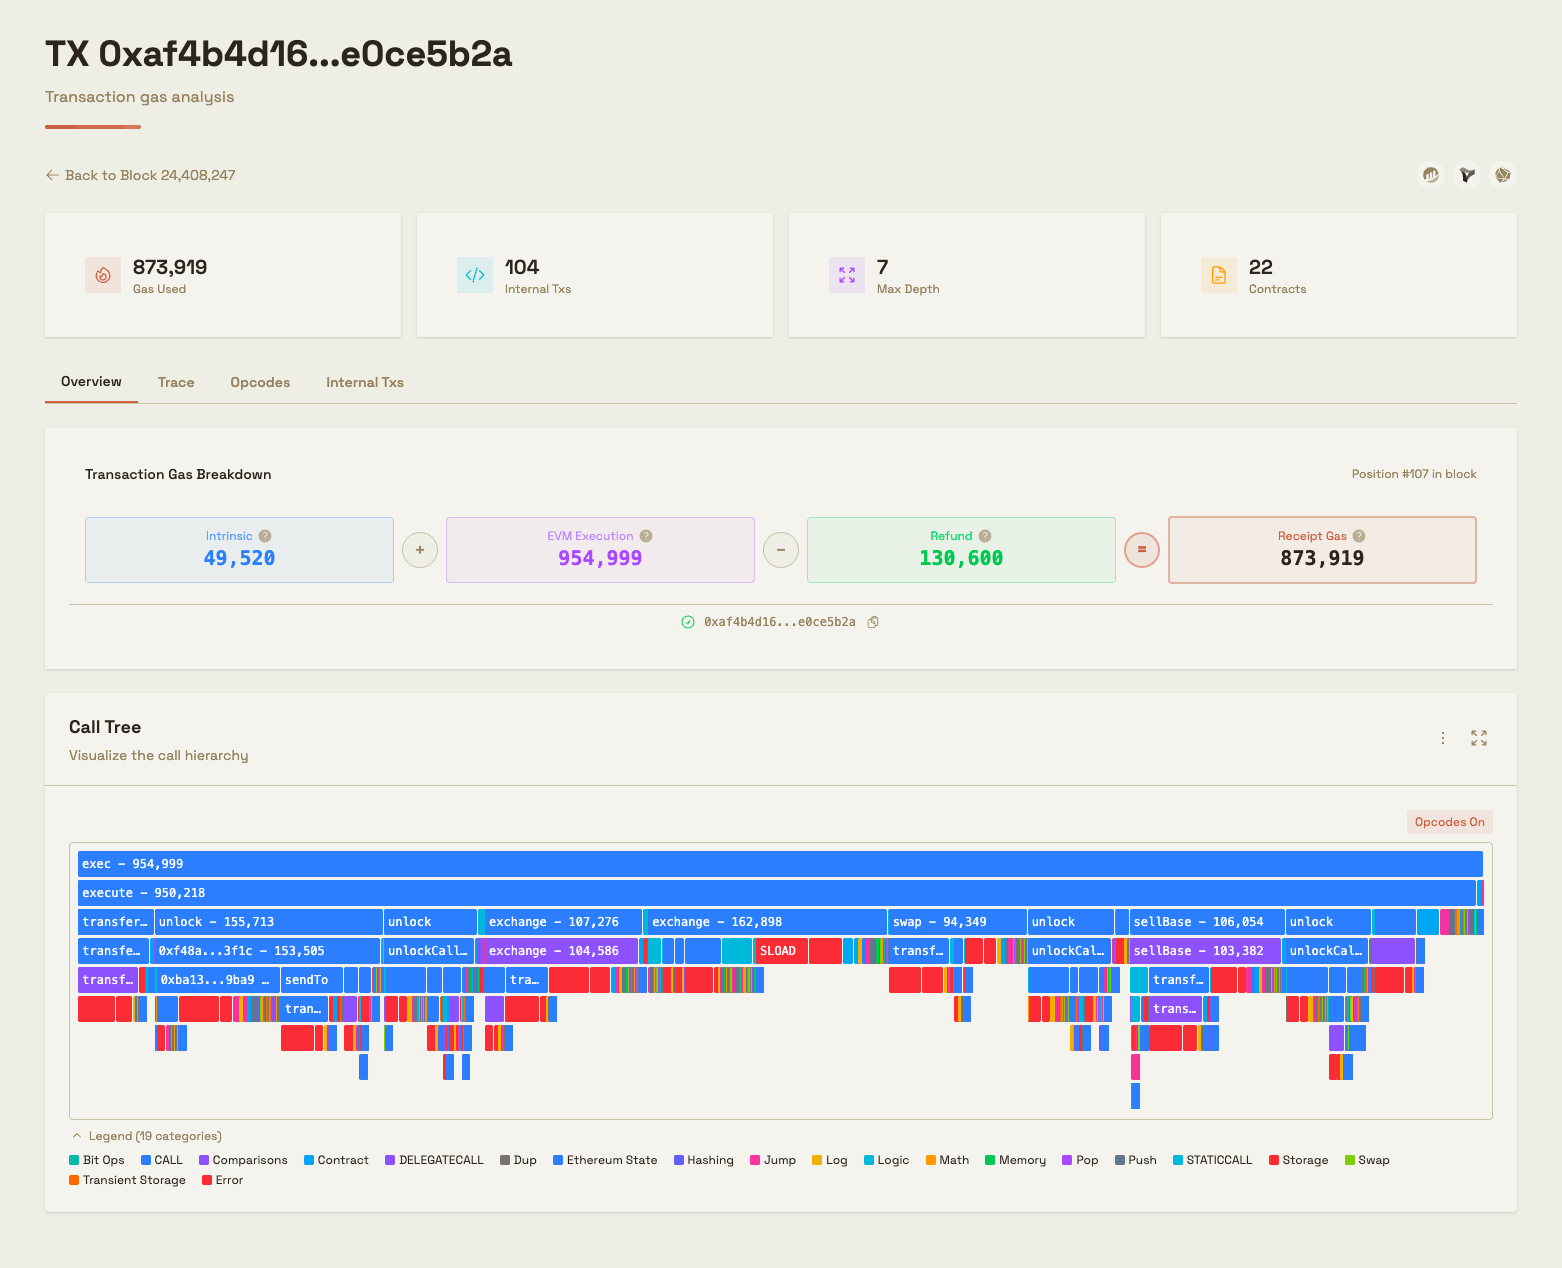
Drill into a block to see per-transaction gas breakdowns and opcode heatmaps. Go deeper into a transaction to inspect the full call tree and opcode-level gas distribution, all the way down to a specific SSTORE inside a nested DELEGATECALL.
The Lab: Gas Repricing Simulator
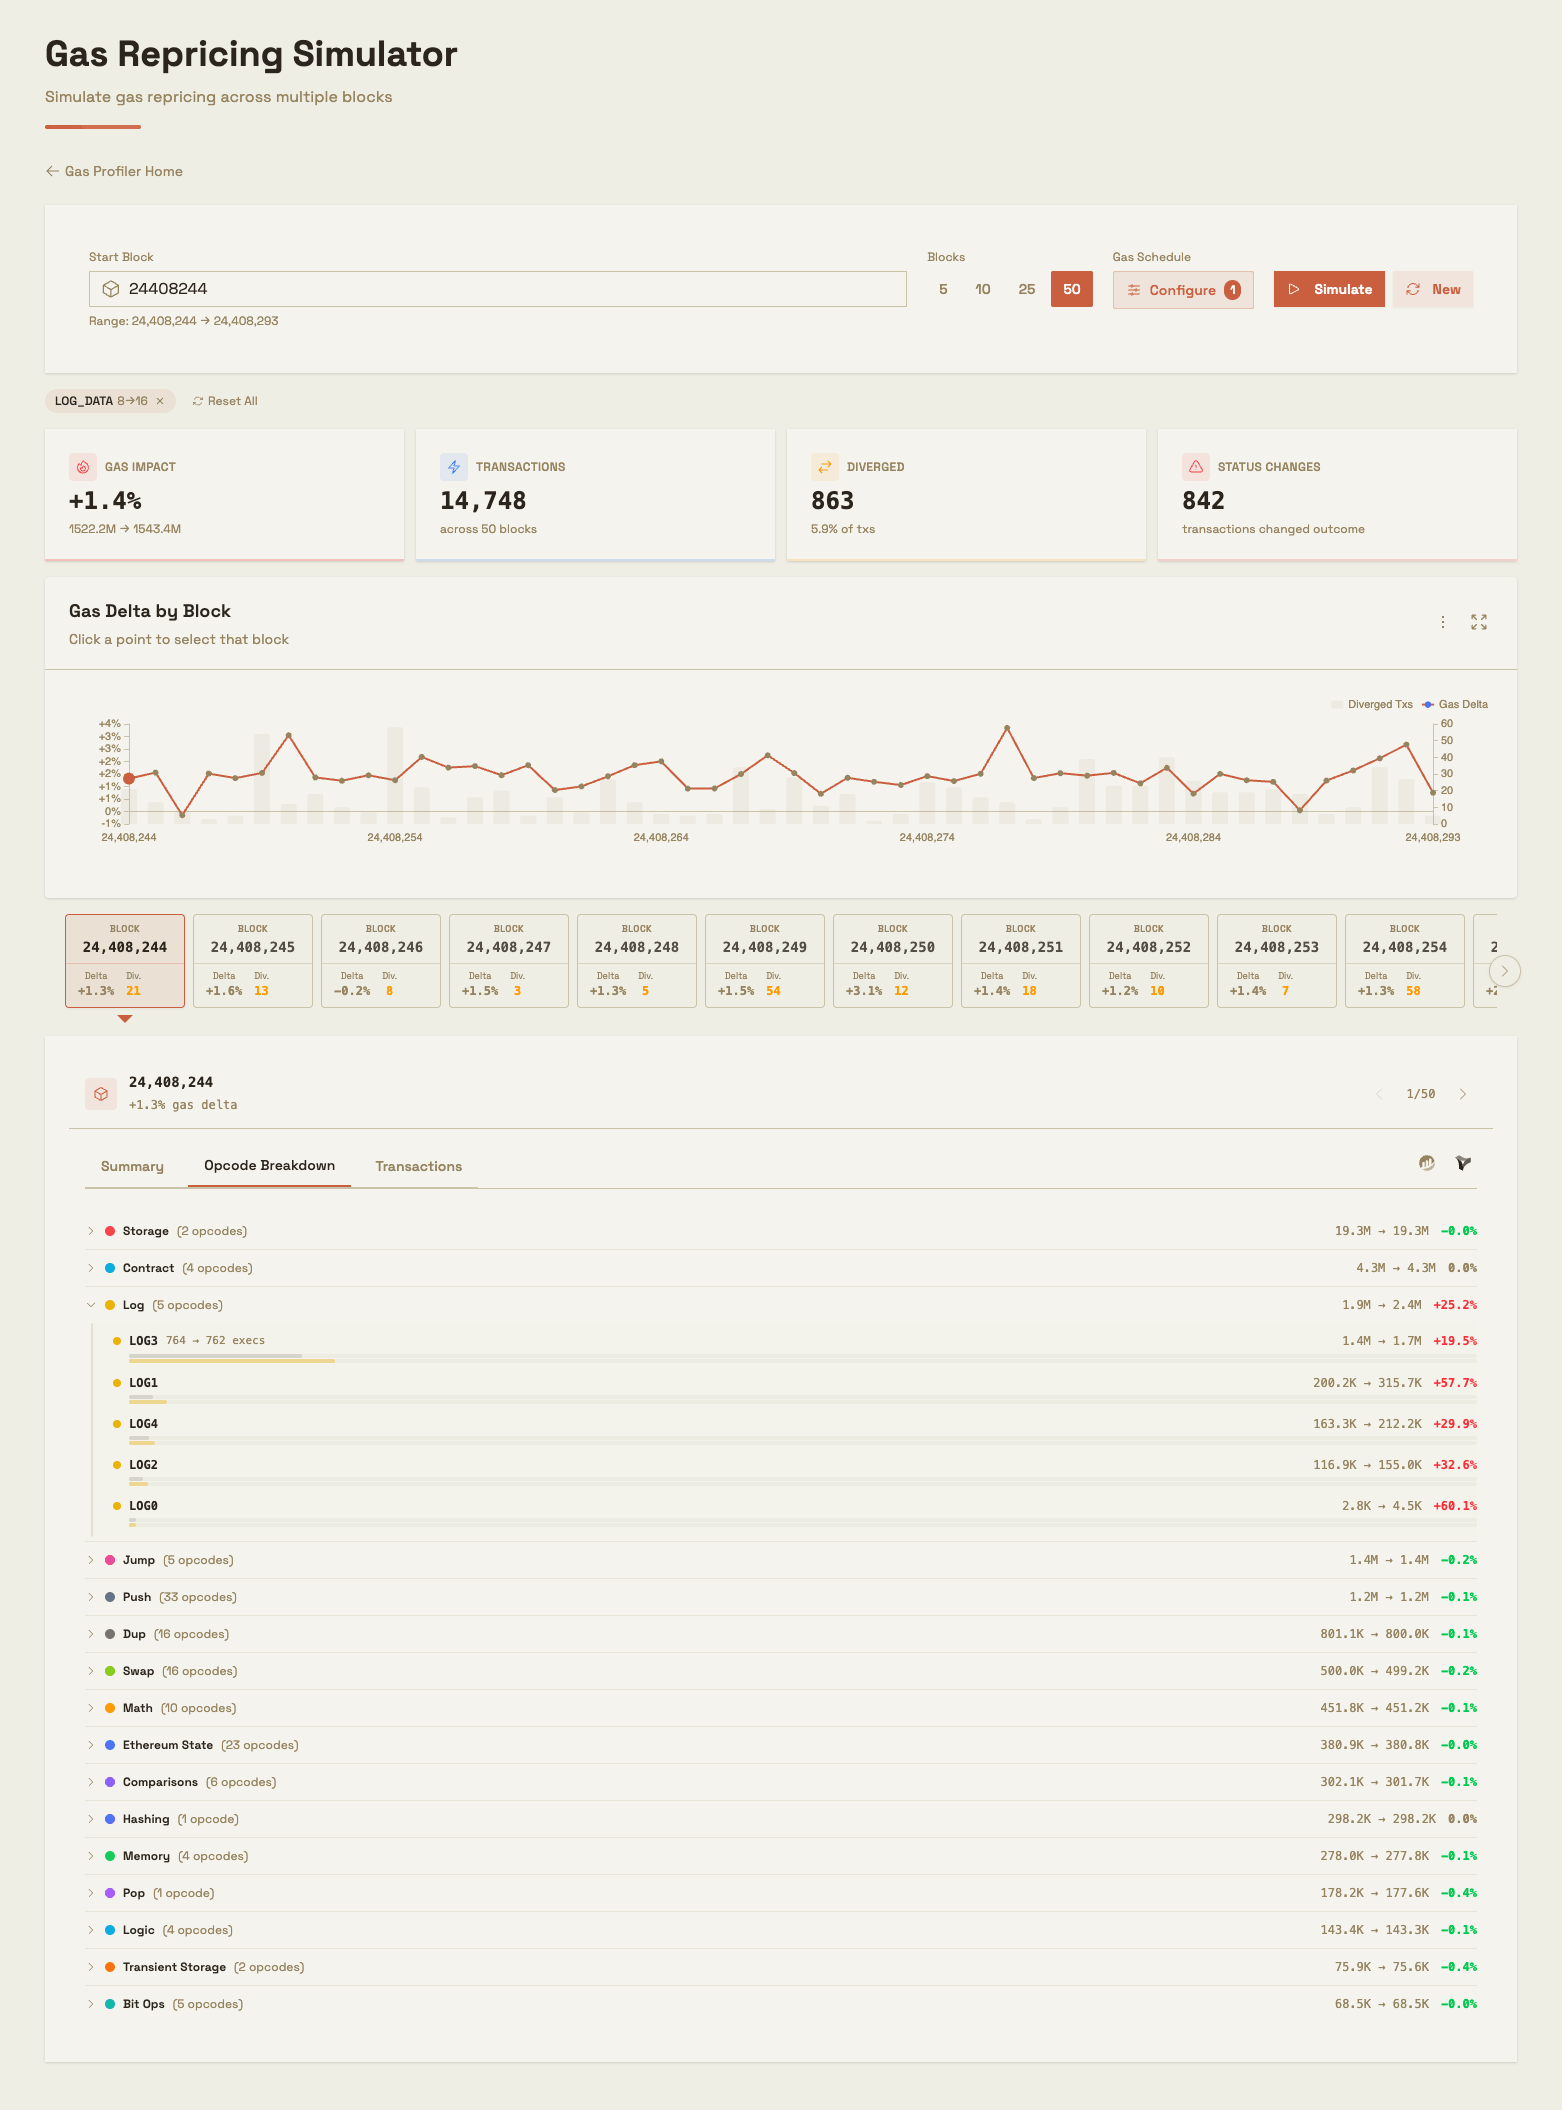
The Gas Repricing Simulator re-executes blocks with a modified gas schedule, running the actual EVM with your custom costs. Pick a block (or a range of up to 50), override any combination of opcode costs and dynamic gas parameters (storage access, call costs, memory expansion, logging, hashing, etc.), and see what changes.
The simulator tells you which transactions would use more or less gas, which would exceed the block gas limit, and which would flip between success and failure. It runs real EVM execution, so contracts that check gasleft() may take different code paths under modified costs. The simulator flags these as diverged transactions.
Say you want to know what happens if SLOAD_COLD goes from 2100 to 3000. Instead of reasoning about it abstractly, you can run it against recent blocks and see exactly which transactions break.
Wrapping up
All 9 tables are live in the Xatu dataset. The Gas Profiler and Gas Repricing Simulator are in The Lab.
If you have questions or ideas for what to build on this data, find us on Twitter or in the Xatu Telegram Group.
Love,
EthPandaOps Team