

With BPO2 out the door, it's time to see how the network is handling the increased blob count. This analysis uses 1 month of block arrival data from Xatu. 147 nodes across 29 countries and 73 cities contributed timing data, many of them run by community members through our public contributor program. This data is combined with the excellent validator data from Miga Labs to identify validator entities.
The first chart of this analysis expedition was very concerning:

Figure 1: Attestation head votes (%) against blob count. 1 month of Mainnet data.
wtf?
We define head votes here as "attestations that voted for the block that was proposed in the same slot". The initial results show a clear drop in head votes as blob count rises.
Obviously this isn't good for our future scaling plans! Could this be the limit of the network? Was this the last ever BPO fork?! 😱
Adding more blobs means more data to publish within the same time window (4s). Combining this with the additional data for attesters to download and verify. Some degradation was expected.. but definitely not this much. Excellent analysis from Chainbound and Miga Labs also found similar results.
We need to investigate further.
Could timing games be the cause? Timing games are when proposers intentionally delay the publication of their blocks to extract as much MEV as possible. For more information, check out Toni's ethresear.ch post.
Methodology
To investigate, proposer entities were categorized by their timing behavior:
- Calculate a Timing Game Score for each entity by looking at the median first-seen block time across their proposed slots
- Bucket entities into three categories:
- Conservative: Score below 0 - blocks arrive early
- Neutral: Score between 0 and 2
- Suspect: Score above 2 - blocks consistently arrive late
- Calculate attestation head vote % for slots proposed by each category
Score Distribution
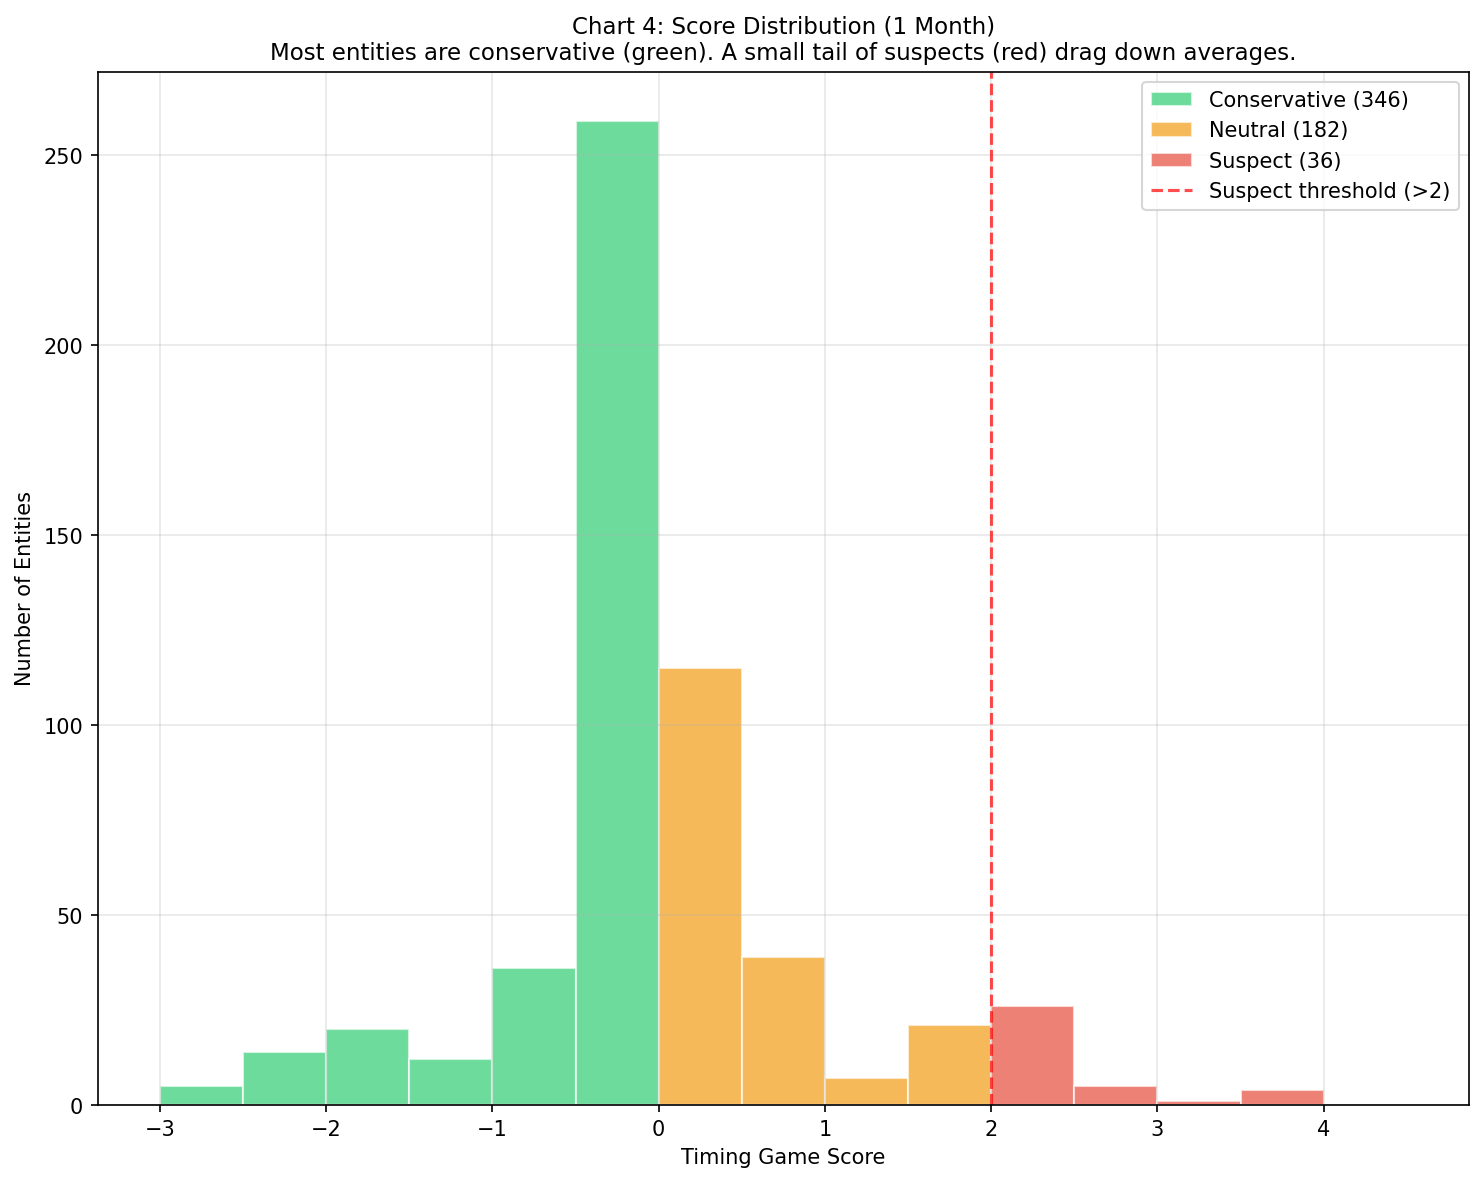
Figure 2: Distribution of timing game scores across 564 entities. Most entities are conservative (346), with a small tail of suspects (36).
Most entities fall into the Conservative bucket (346 entities). 182 are Neutral, and only 36 are flagged as Suspect. The red dashed line marks the suspect threshold at score > 2.
Timing Scores by Entity
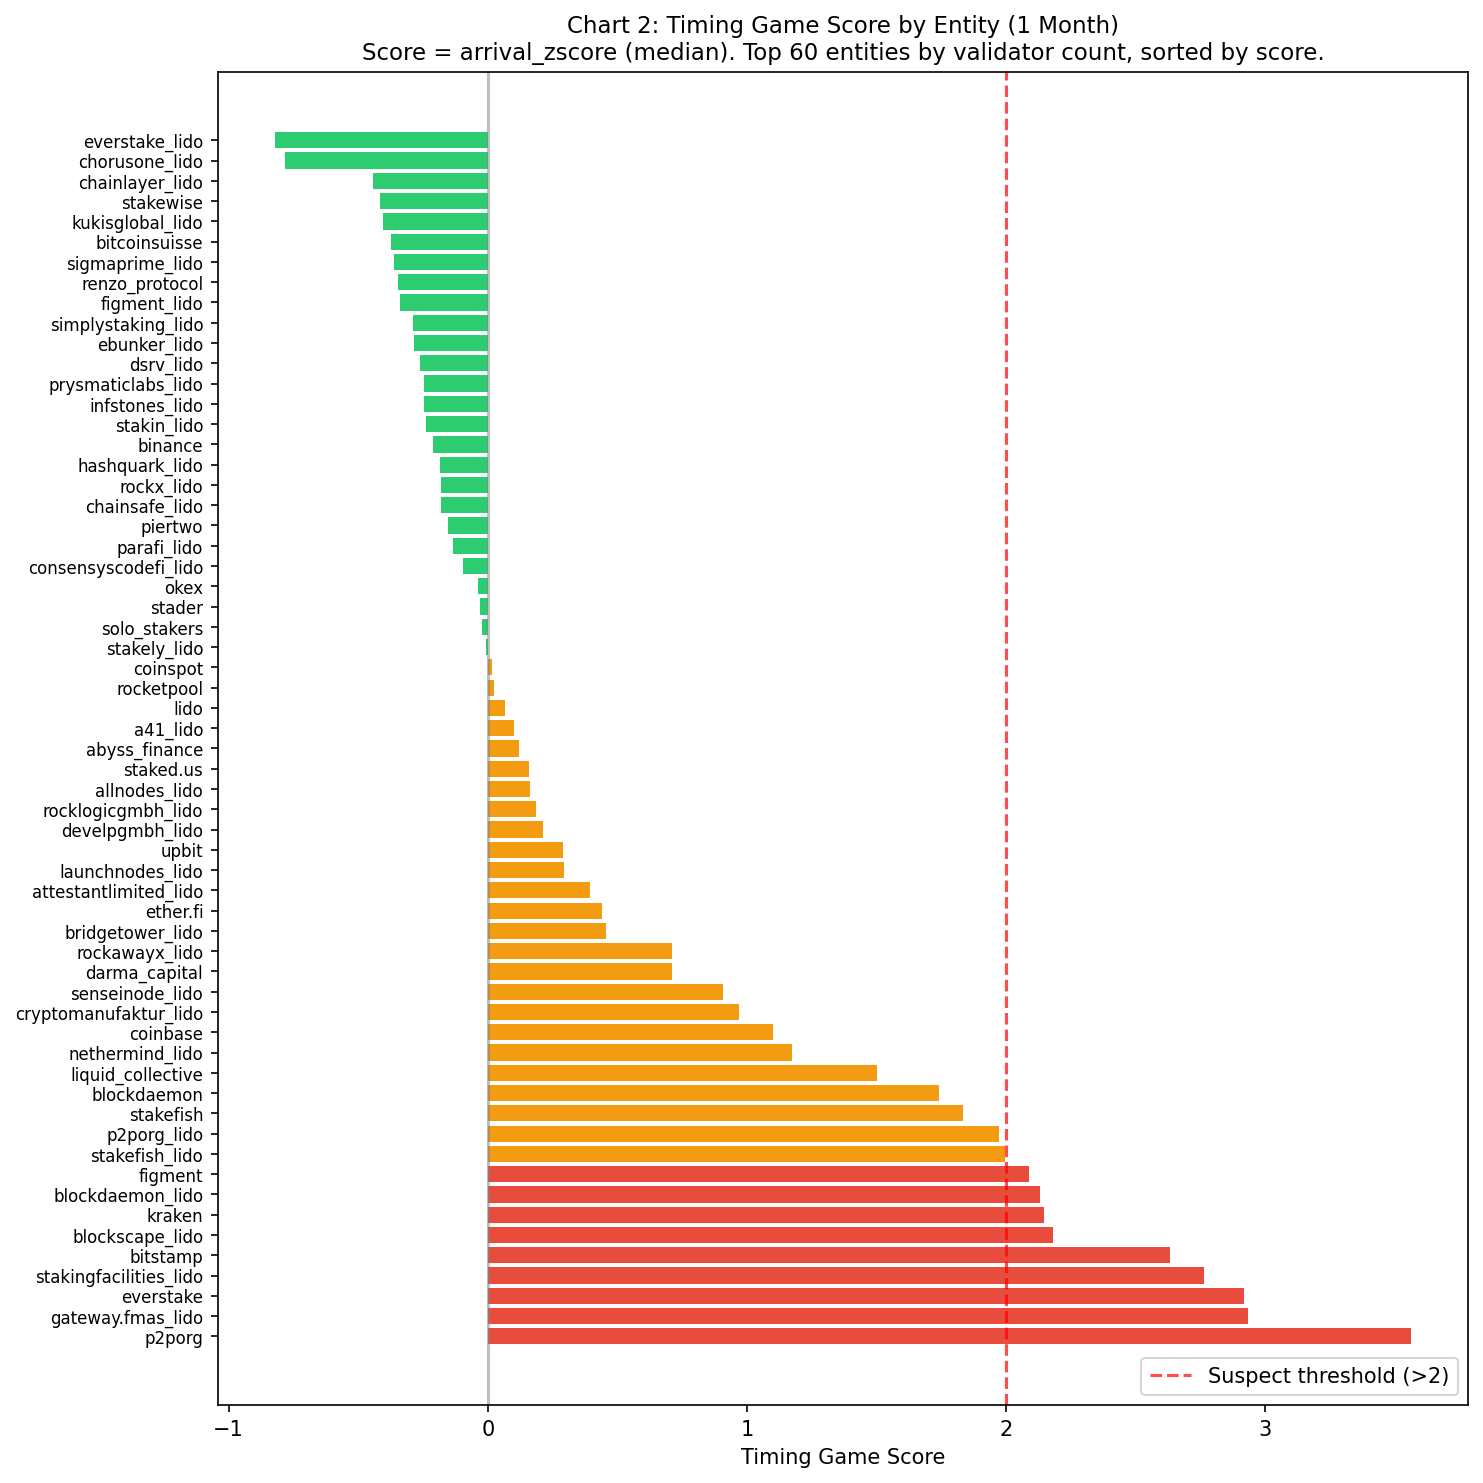
Figure 3: Top 60 entities by validator count, sorted by timing game score.
This shows the top 60 entities by validator count, sorted by their timing game score. A clear gradient runs from conservative entities at the top to suspects at the bottom. A Suspect entity here doesn't necessarily mean they're a bad actor or intentionally playing timing games, it just means their blocks are consistently arriving late to the Xatu nodes.
Entity Performance Overview
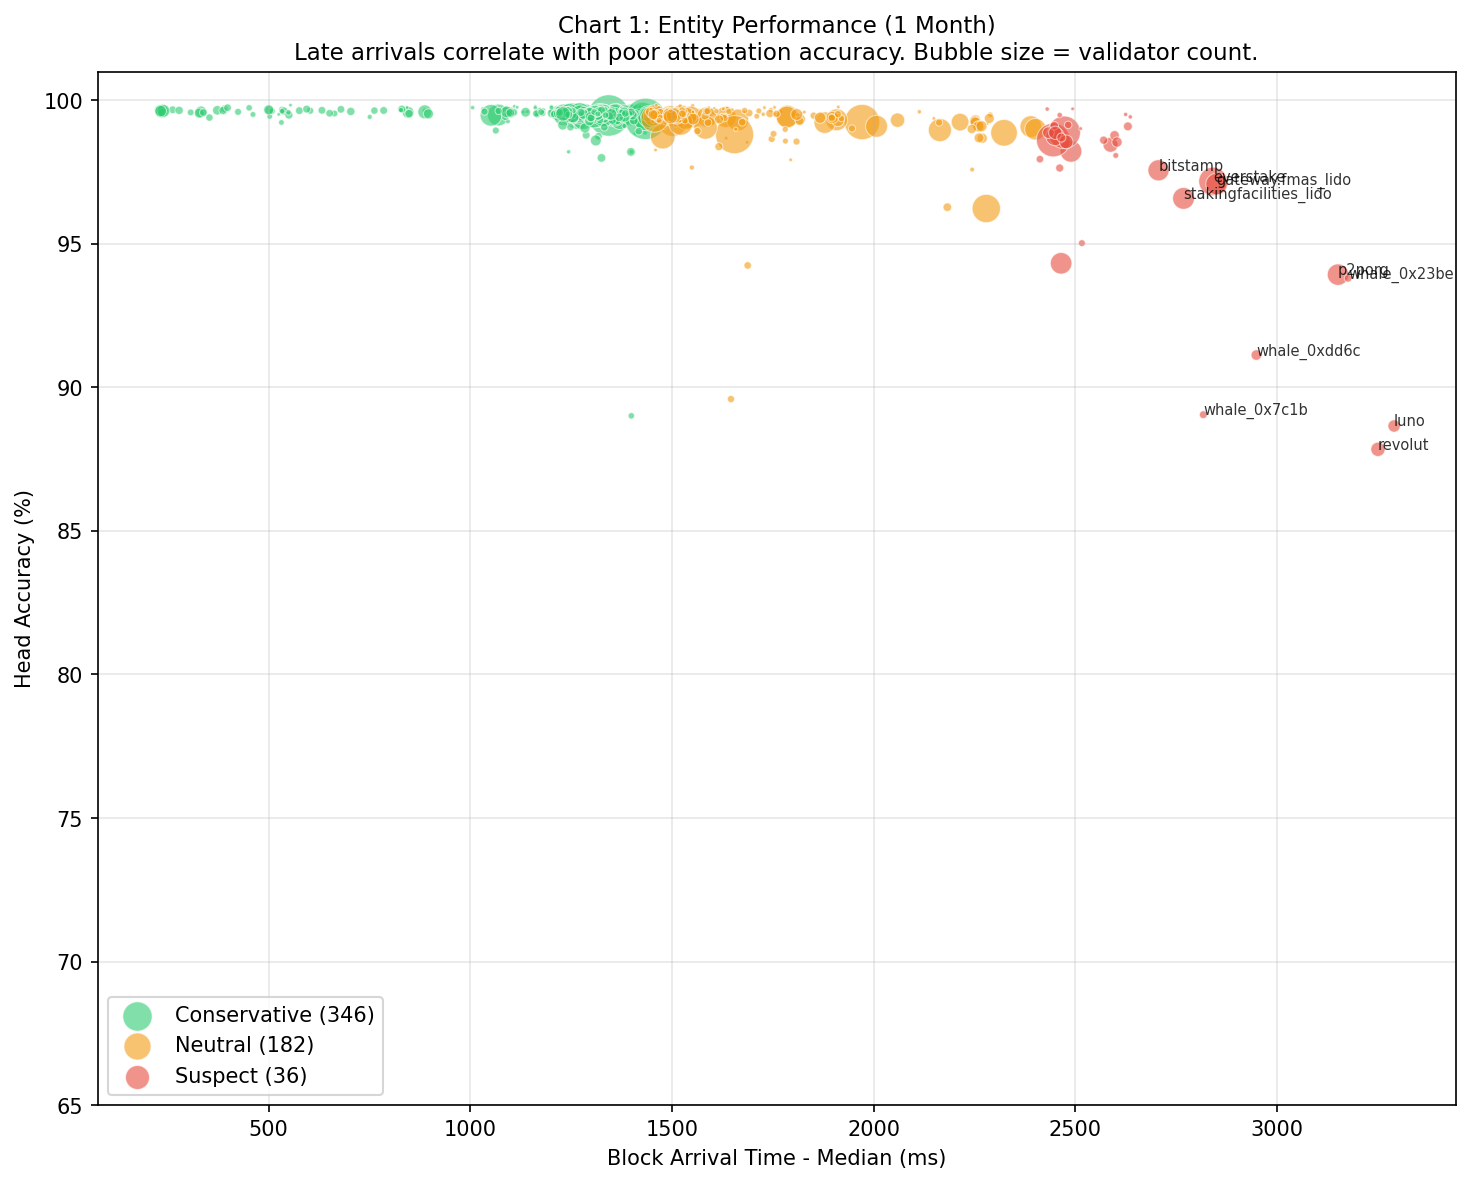
Figure 4: Entity performance scatter plot. X-axis: median block arrival time (ms). Y-axis: head vote percentage (%). Bubble size: validator count.
Each dot is an entity. The cluster of green dots on the left side (early block arrivals) all sit at ~99-100% votes. As you move right into late-arriving blocks, votes for the proposer's block drop.
With this relationship established, we can now look at how blob count affects each timing category.
Results
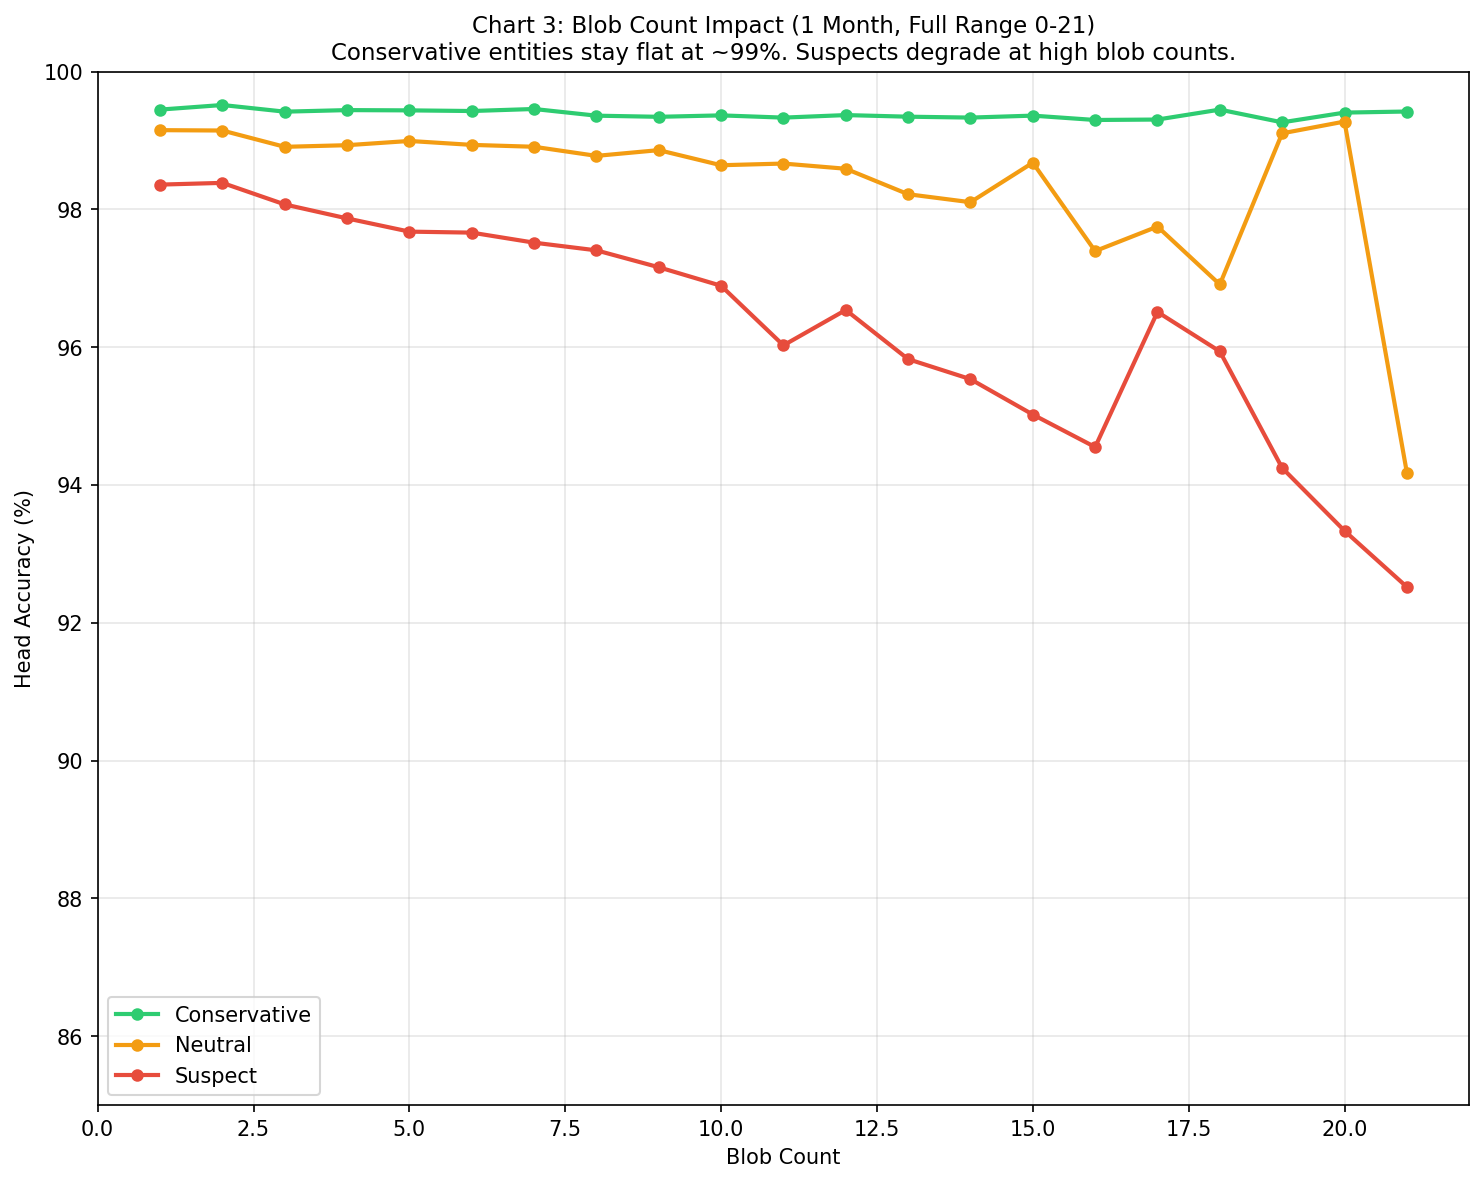
Figure 5: Head vote percentage (%) vs blob count, grouped by timing game category.
The green line stays flat at ~99% regardless of blob count. I breathed a sigh of relief here. This is a good sign!
Conservative entities that publish blocks promptly maintain near-perfect attestation head votes even at 21 blobs. The decay observed in the aggregate chart is almost entirely driven by entities playing timing games.
The Suspect group (red line) starts at 98% with 1 blob and drops to 92% at 21 blobs. Neutral falls somewhere in between.
This makes sense: if blocks are already being published late, adding more blobs makes an already tight timing window even harder to hit.
Data Notes
- Time period: 1 month
- Exclusions:
- Slots with less than 5% attestation rate (likely infrastructure issues rather than timing problems)
- Time periods where there were known issues with clients that were unrelated to the analysis.
Takeaways
- Timing games, not blob count, are the primary driver of attestation degradation.
Conservative entities maintain ~99% head votes even at max blob counts.
- Timing games proposers aren't going anywhere..
Even though we're seeing a clear degradation in head votes, the Suspect entities are still able to maintain a high enough head vote percentage to keep their blocks in the chain. Core devs and the community need to account for this in future planning. We can't ignore these entities.
- Proposing a block is getting harder.
All large operators should be monitoring their infrastructure closely.
While this analysis is a good starting point, it doesn't cover the full picture for justifying the next BPO values. More data and analysis is needed. We'll continue to monitor the network and publish more analysis as we go.