
Most validator issues start with an alert or an odd looking chart, but it can be difficult to dig in to what's actually happening. Usually all you have is a validator index and a rough time range, but digging through the data can be a little overwhelming. That's where the new Validator Report page in The Lab comes in, allowing you to turn a "something looks wrong here" report into a specific validator, date, hour, and slot.
For this walkthrough I loaded twelve public mainnet validators into a recent report window. Most of the group looks healthy, but two rows matter once you look closer. This is a common pattern for node operators where data is lost in layers of aggregation.
Click a day cell, then an hour cell; the matrix drills down while the table expands underneath.
Find the Outlier
The summary cards at the top gives you a quick glance at the state of your validators.
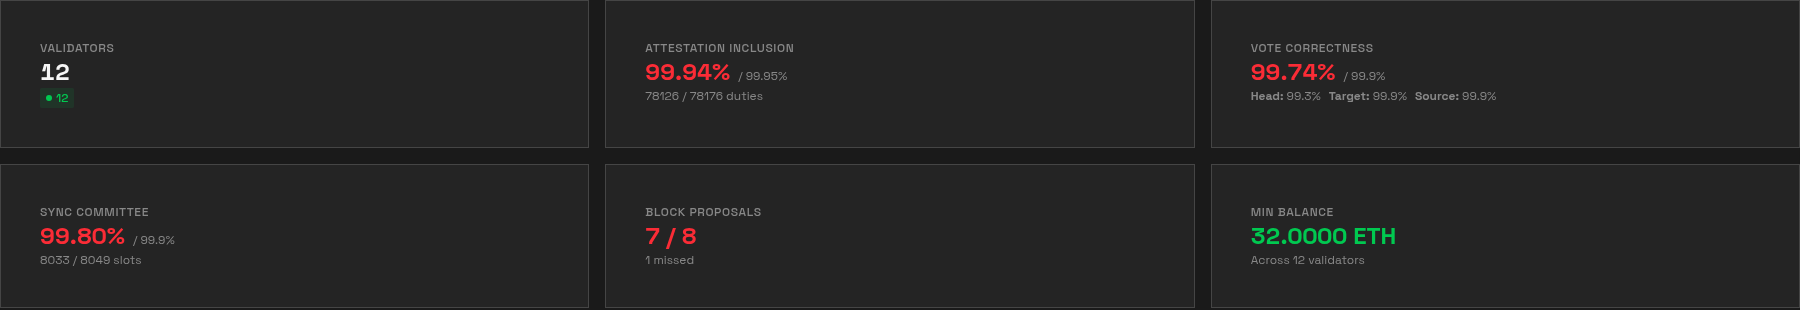
The summary is mostly healthy, but the proposal card and head-vote sub-metric break pattern. Screenshots use stricter thresholds; the data stays the same.
Across these twelve validators the baseline is solid: 99.94% attestation inclusion, 50 missed duties, 99.74% vote correctness, and every validator active. The soft spot is head votes at 99.3%.
The proposal card shows that we've missed 1 block proposal (7/8). Block proposals are more straight-forward to track, so let's start with the missed proposal, then inspect the head-vote thread later.
Catch Proposal Misses
Validator 1329583 is the missed-proposal row: 0 / 1. Validator 2061162 is the clean comparison at 2 / 2.
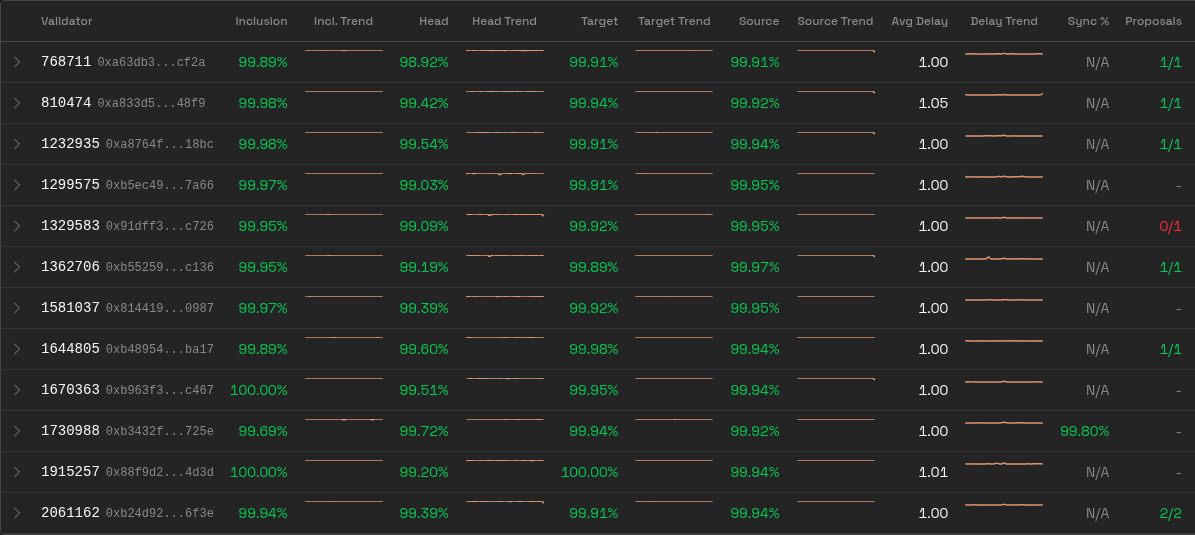
Validator 1329583 shows 0 / 1 proposals while validator 2061162 shows 2 / 2.
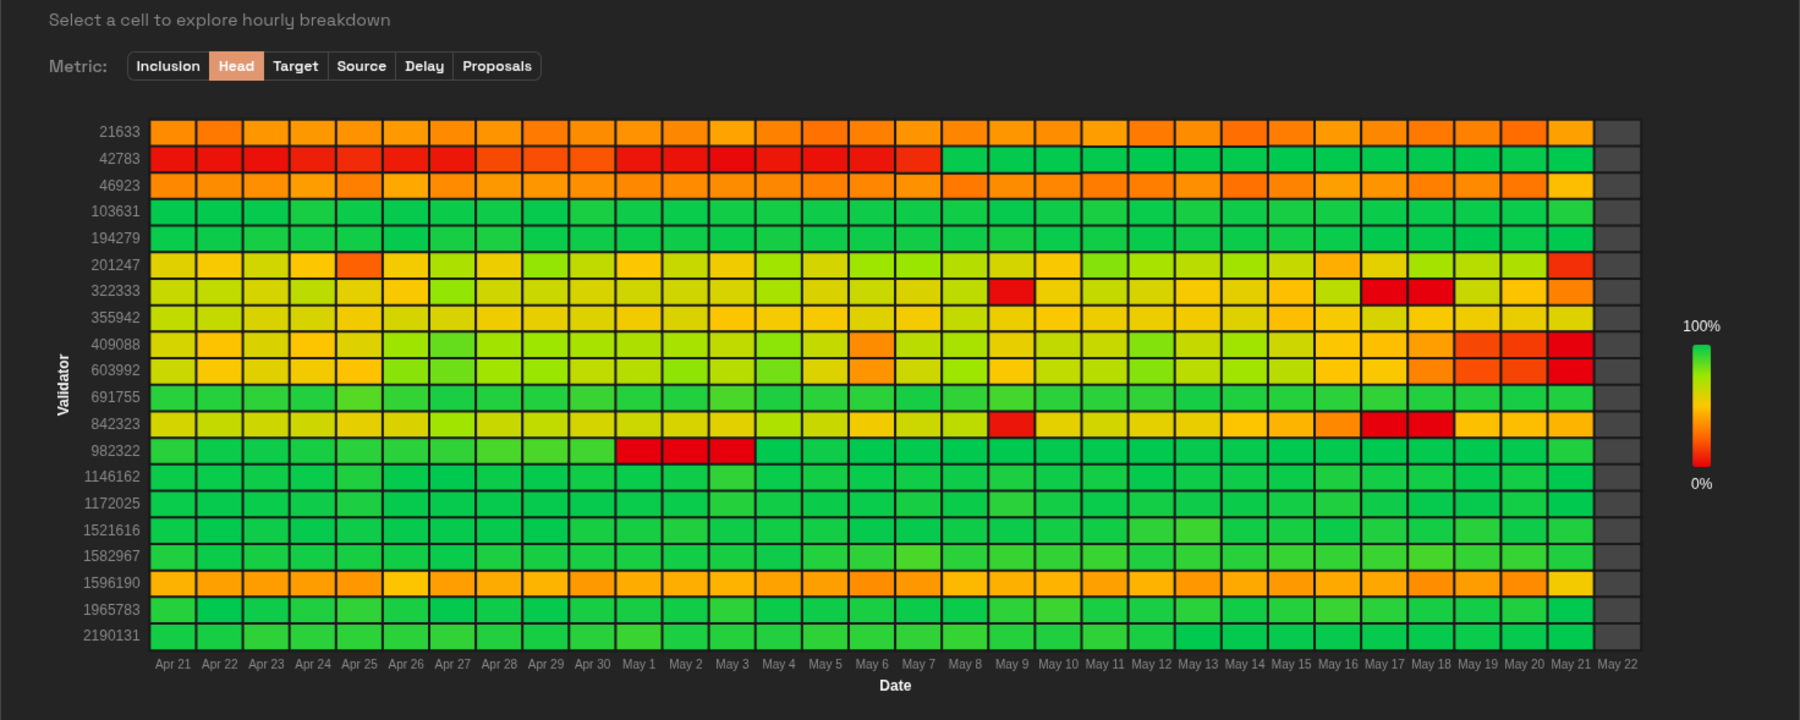
Find the Head-Vote Drop
We first look at the per-day performance, and we don't exactly find our smoking gun in the Inclusion Delay metric. Swapping over to Head, and the overall performance still looks pretty uneventful. We can notice a slight dip for validator 1299575 with May 13 landing at 94% head accuracry. All of the cells here are clickable, but hover it first to get a quick summary.
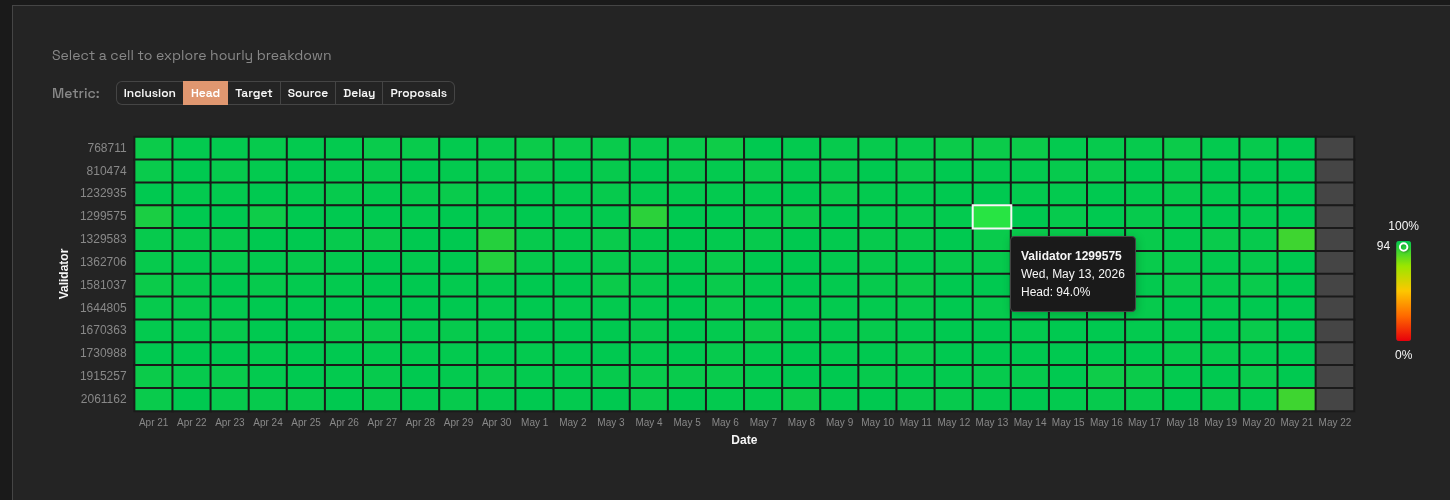
Hover the daily cell first: validator 1299575, Wednesday May 13, 94.0% head votes.
The chart flips from days into hours for that exact date, and we finally start to see what's happening here.
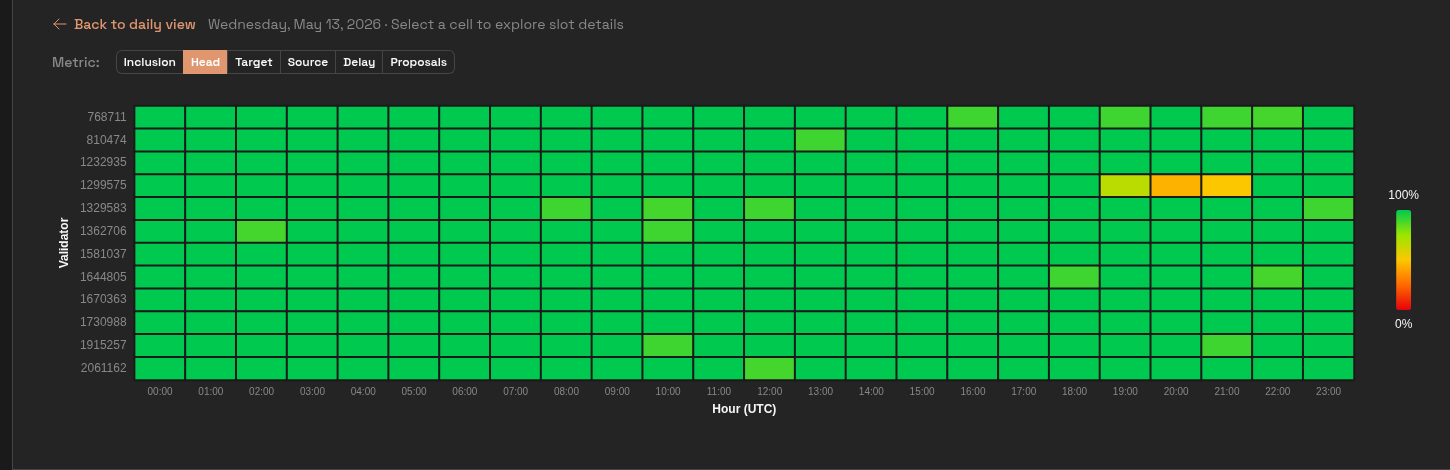
One click opens the hourly matrix; the 20:00 UTC tile drops to 44.44% head votes.
Then open 20:00. That hour drops to 44.44% head vote correctness with 1.33 average inclusion delay. The slot rows underneath show the actual receipts: missed head votes and one attestation that took 3 slots to land.
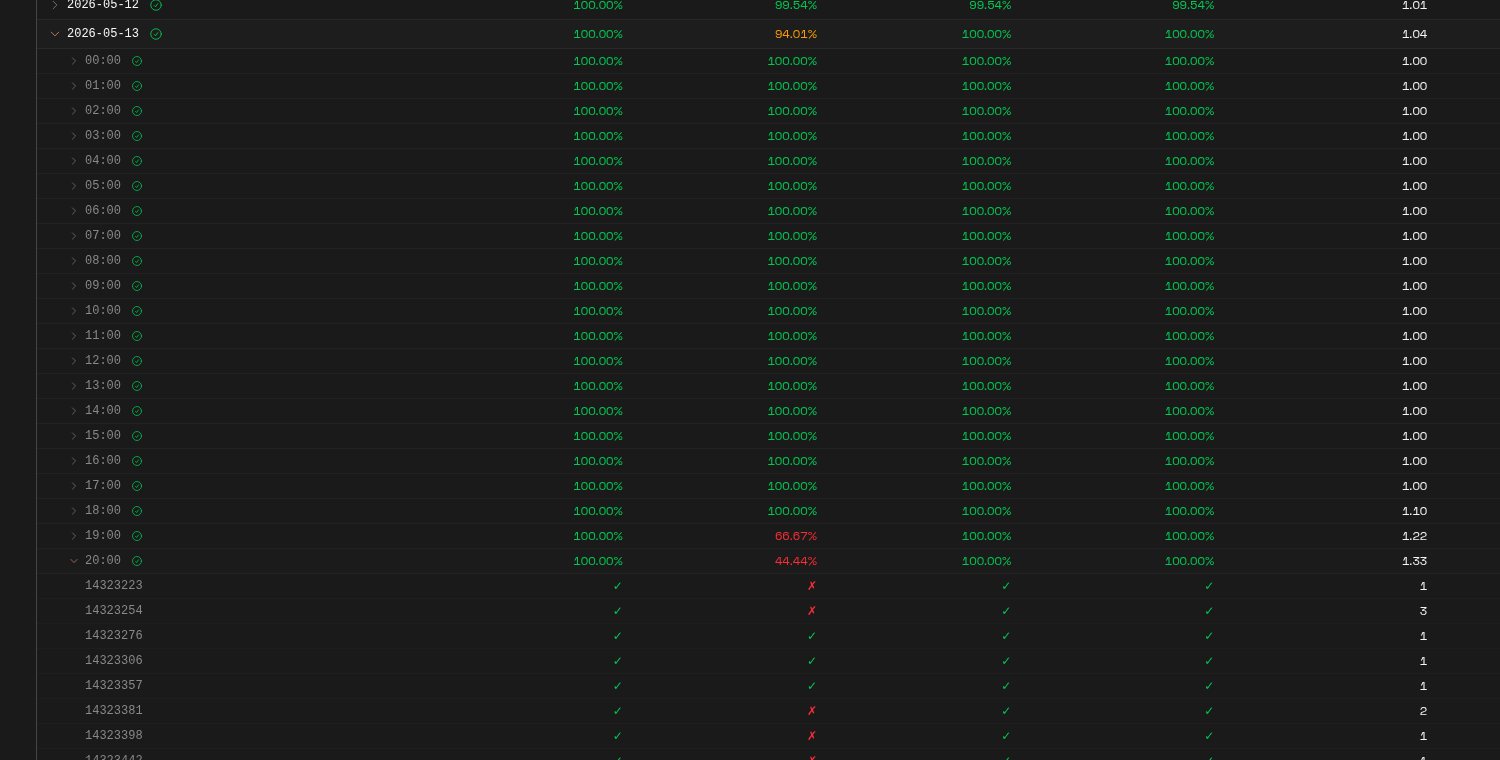
The static receipt: validator 1299575 -> 2026-05-13 -> 20:00 -> slot rows.
We've finally found some slots where things went wrong. From here, it's time to look at node logs and figure out what happened. For these slots, I've found that it's useful to correlate with other data on The Lab, particularly the Slot View.
Save the Trail
The URL is shareable, meaning you can send it to another operator and they'll land on the exact same view (down to the slot.) We've also baked in a Download Report function, which allows you to export Markdown of the current thresholds.
Love,
EthPandaOps Team